Data Science
Artificial Intelligence (AI), Machine Learning (ML) & Deep Learning (DL)
In the contemporary business landscape, Data Science plays a crucial role in addressing complex enterprise challenges, particularly in the management of supply chains for large corporations. Traditionally involved in research, analysis, design, building, testing, and maintenance of products and services, Data Science has evolved.
Our focus is on enterprise operations, utilizing business and industrial data, and executing diverse projects to enhance quality output and cost management. This encompasses various aspects, including Strategic and Operating Plans, Marketing, Sales, Purchasing, Warehousing, Production, Distribution, and Customer Service.
Embracing the latest advancements, we leverage Large Language Models (LLMs) and harness the power of generative AI to drive innovative business solutions in the field of data science. Generative AI refers to a branch of artificial intelligence focused on creating new data, content, or outputs, often mimicking human-like creativity and innovation. It encompasses algorithms and models that generate text, images, music, and other forms of media autonomously, based on patterns and training data. Generative AI has applications in various fields such as content creation, design, healthcare, and entertainment, and is continuously evolving with advancements in technology and research.

Creates New and Computation Metadata
Computational Statistics
We typically utilize a two-dimensional (2D) space, plane, or X,Y plot to correlate or associate variables, as moving beyond two dimensions can become challenging to comprehend. Data Science plays a crucial role in the database, performing computations across numerous records, dimensions, dates, and numeric values.
Data Science is intricately linked to "Computational Statistics," leveraging computers and statistical methods. Alexicon excels in transitioning data science code from frontend desktop workbooks to the Enterprise Data Warehouse (EDW) and/or Data Lake (DL). The EDW serves as a robust data source for structured data science computations, including models and schemas, as well as process analytics.
The EDW offers a centralized service for analytics and data science users, ensuring a single source of truth. This becomes particularly significant when executing substantial backend computations across the Enterprise and when users demand interaction with speed and accuracy.

Alexicon uses SQL, R, Python and Scala for EDWs and Enterprise Data Lakes (EDLs). Excel, W3Schools, SQL, Python and R examples are used below.

Data science is a "concept to unify statistics, data analysis, informatics, and their related methods" in order to "understand and analyze actual phenomena" with data. It uses techniques and theories drawn from many fields within the context of mathematics, statistics, computer science, information science, and domain knowledge. - Wikipedia
Simple Linear Regression
Simple Linear Regression is basic and used extensively in Data Science. Below is an Excel and Python (Anaconda Jupyter notebook IDE) example. Simple Linear Regression is used across many data science areas.

Multiple Regression
Multiple Regression is similar to linear regression and used for prediction by using more than one independent value.


AI applications include advanced web search engines, recommendation systems (used by YouTube, Amazon and Netflix), understanding human speech (such as Siri or Alexa), self-driving cars (e.g. Tesla), and competing at the highest level in strategic game systems (such as chess and Go), As machines become increasingly capable, tasks considered to require "intelligence" are often removed from the definition of AI, a phenomenon known as the AI effect. For instance, optical character recognition is frequently excluded from things considered to be AI, having become a routine technology. - Wikipedia
AI covers many areas. Our data science focus is around Analytics, Predictive Analytics, Forecasts, Root Cause Analysis and Enterprise Optimization.

Machine learning algorithms build a model based on sample data, known as "training data", in order to make predictions or decisions without being explicitly programmed (note the projection lift).
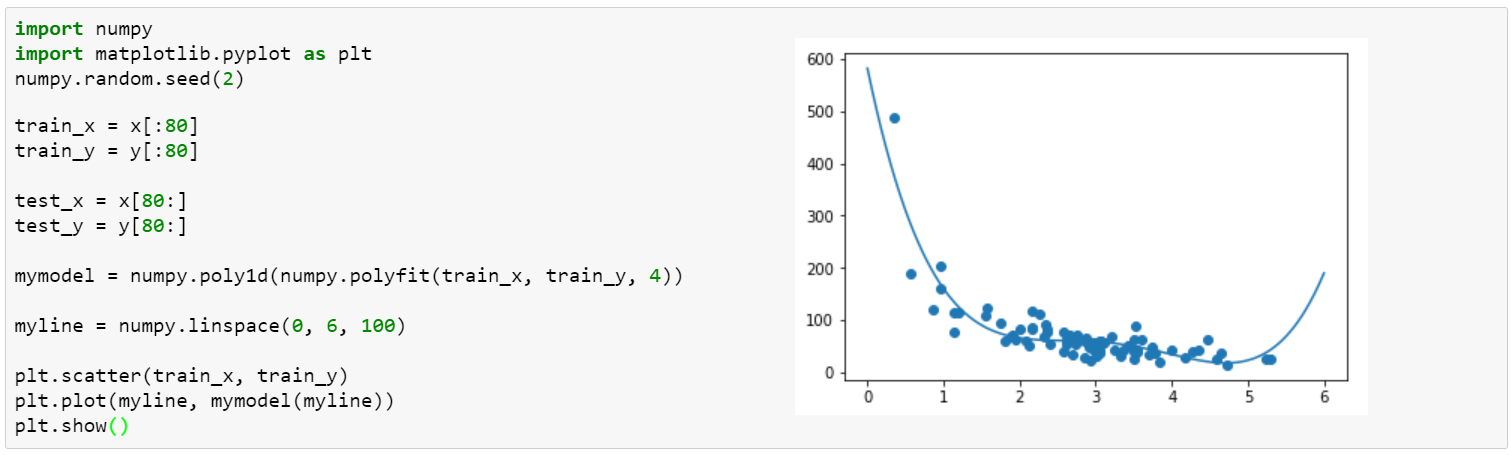

Deep learning (also known as deep structured learning) is part of a broader family of machine learning methods based on artificial neural networks with representation learning. Learning can be supervised, semi-supervised or unsupervised. This is similar to Machine Learning above with Test and Train manually setting categories or automatically creating them working with both data or images.
Generative AI is part of deep learning techniques, comprising colossal neural networks that have the ability to generate new, synthetic data that is similar to the training data they were exposed to.


Designed to establish causal relationships and identify cause-and-effect relationships. While typically used in Six Sigma, DOE is a powerful data collection and analysis technique that can be used in a variety of experimental situations. It allows for multiple input factors to be manipulated, determining their effect on a desired output (response). Below an example of data used with DOE. Minitab is a popular tool for DOE along with R and Python.


Enterprise. Orchestrated.